Temperatures, fan speeds, clock rates, power and voltages — for the CPU, GPU, memory, drives
and board, read straight off the hardware, updated a few times a second, live on your own
machine.
Rather not install anything?
Portable alpha (.zip)
· · unzip it anywhere and run Maxer Portable.exe. No
service, nothing in the registry, and it never starts with Windows.
Its SHA-256.
Windows 10 or 11, 64-bit. Installs in about a minute.
This is a Windows program. It reads your hardware through a Windows driver,
so there is no macOS or Linux version — not yet, and not soon. The download will not run on
the device you are using now.
Before you install
This is an alpha
It is early software, and it is offered as-is. Expect rough edges, expect to find bugs, and
do not run it on a machine where an unstable background service would be a problem.
It installs a Windows service that starts with your PC, and it can install
a sensor driver — that driver is what makes CPU temperature, fan speeds
and motherboard voltages readable at all.
Everything stays on your machine. Uninstalling removes the app and its service from
Apps & Features like any other program.
Windows will warn you the first time
You will see “Windows protected your PC”. That is SmartScreen reacting to an
installer it has not seen before, not a virus warning — our installer is not yet
code-signed, and a signing certificate is the only thing that removes it.
Temperatures, fan speeds, clocks, power draw and voltages, for the CPU, GPU, memory, drives
and board — from the hardware itself, not an estimate. The same sensors your motherboard
reports, read with
LibreHardwareMonitor (opens in a new tab).
Everything in one place
Every part of the machine in one view — CPU, GPU, memory, drives and board — instead of
three or four separate utilities each showing a corner of it.
Stays out of the way
It runs as a background service with an icon by the clock. There is a window when you want
one, and nothing that has to stay on screen — and it starts with Windows, so a machine
keeps reporting after a restart.
Keeps itself current
New versions install themselves, after checking a signature only we can produce. You can
switch that off, and check for updates by hand from the icon's menu.
What it looks like
Real captures from a Ryzen 7 9700X and an RTX 4080 SUPER. Step through them, and click any one
to see it full size.
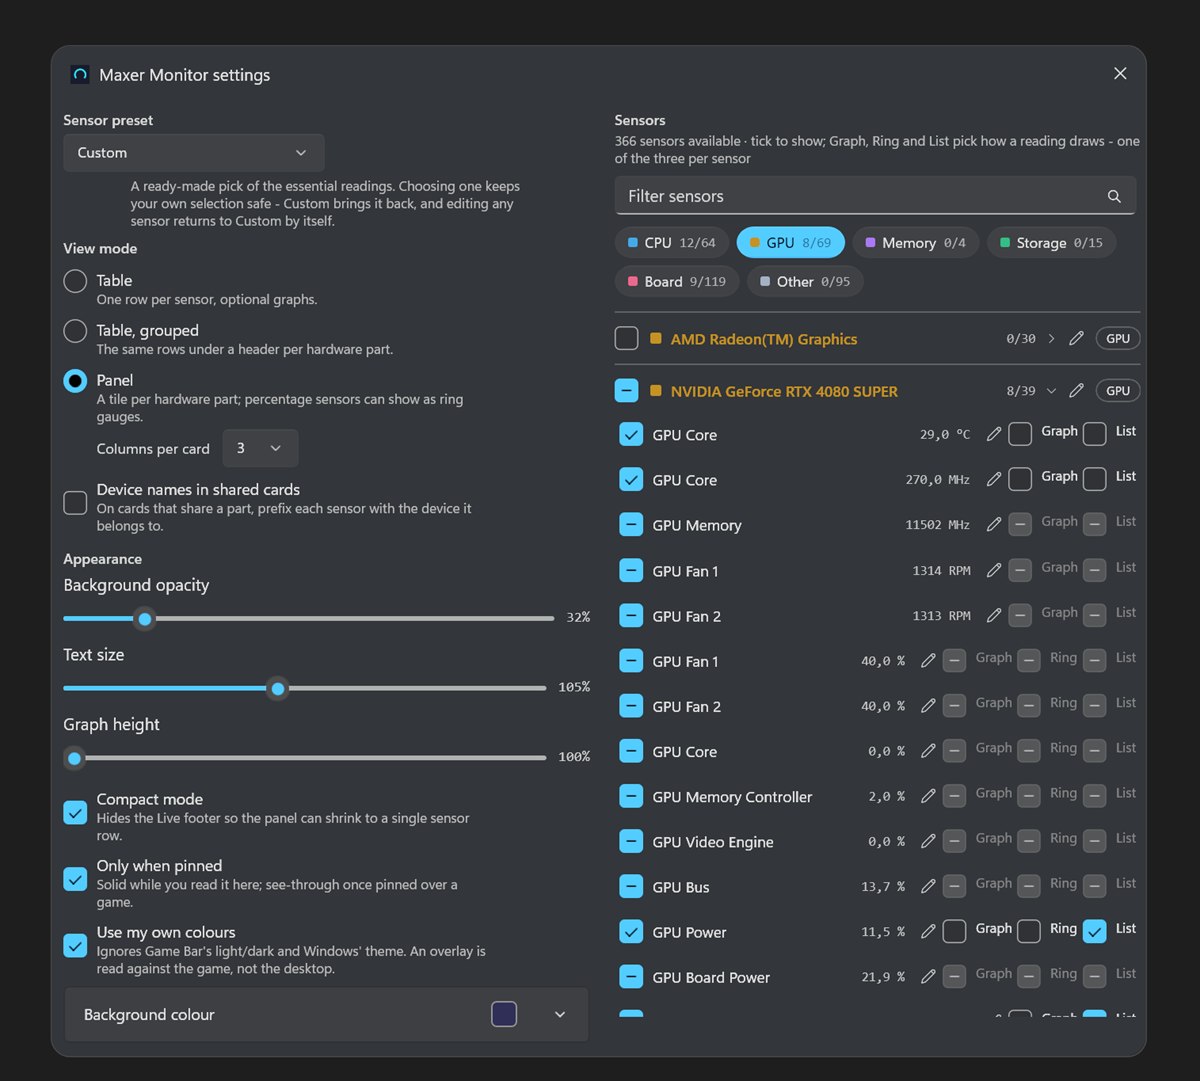
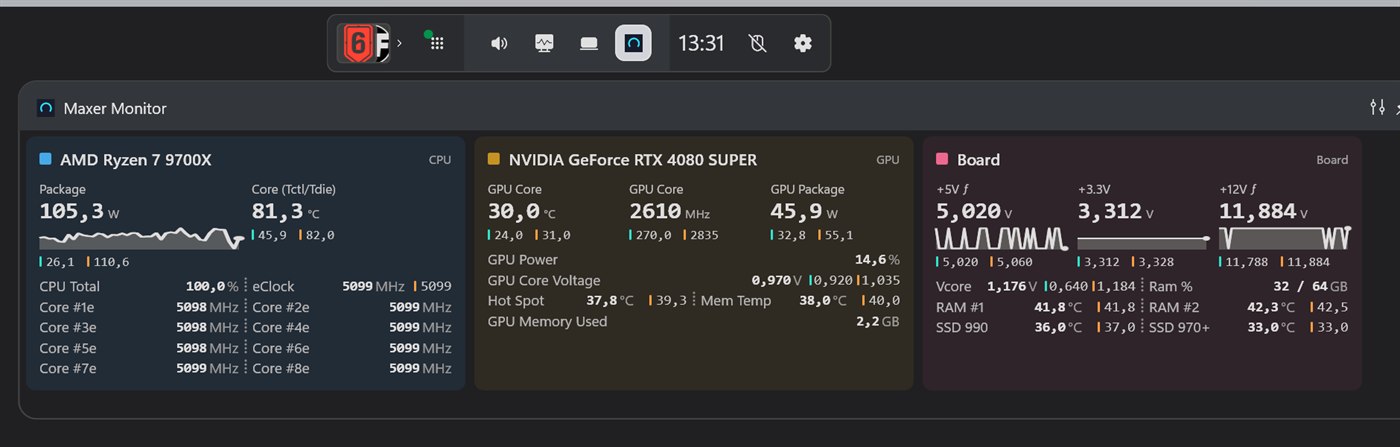
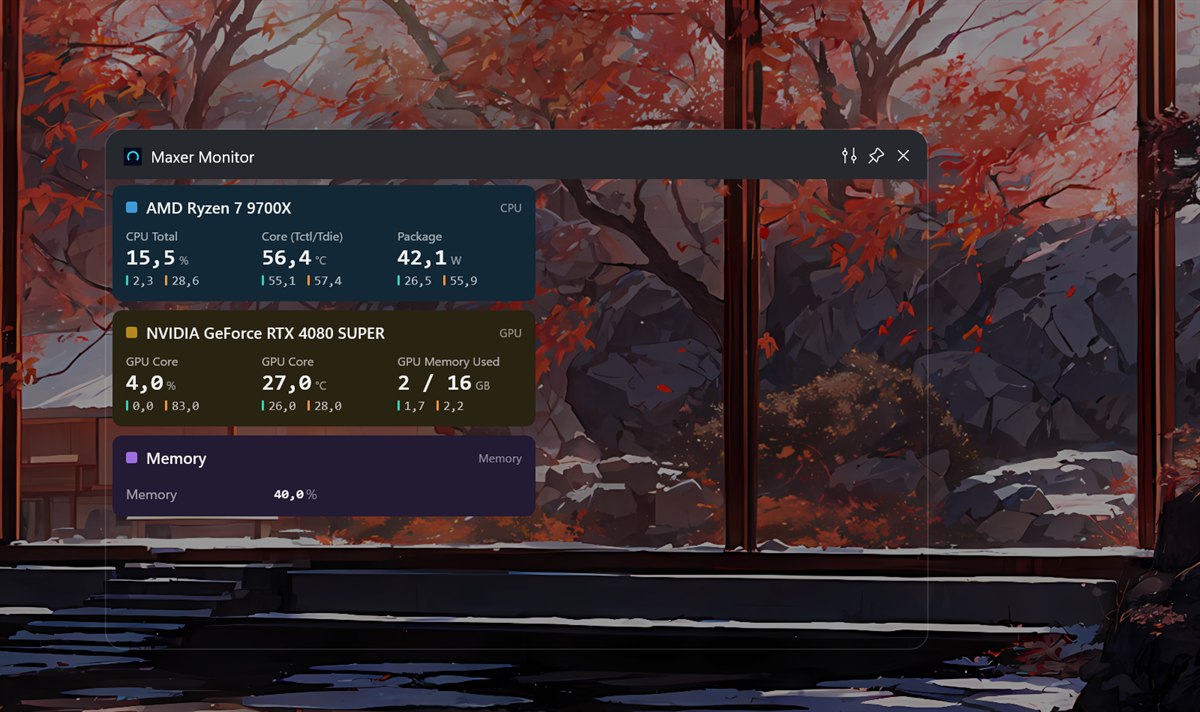
One card per part. Every reading carries an icon for what it measures, and a marker for where it sits in its range.It is an Xbox Game Bar widget, so it opens over whatever you are running.Pin it and it stays put, as see-through as you set it.Pinned to the desktop instead, above whatever else is open, with the board's rails drawing as they move.Through an all-core render test: 100% load, 105 W into the package, every core at 5.1 GHz.A GPU stress test at 100%: 319 W, 66 °C at the core, 79 °C at the hot spot — and the test’s own panel reads the same.Both at once, over a rendered scene — with the board, memory and drives merged into a single card.Wide instead of tall — the same three cards side by side, each reading still carrying its lowest and highest.Or trim it to the few you actually watch — three cards, two headline numbers each.A fresh install starts here — CPU, memory, GPU and drives already picked.Pick from every sensor the machine reports — this one offers 366 — or take a preset.There is a window when you want one — the same cards as the widget, and a sensor-health view beside them.All sensors is every reading the machine reports, grouped by device, each with its lowest, average and highest.Lay the same list out in columns, and open a graph under any reading to see its last thirty seconds.Every reading has its own options: where it shows, its colour, its graph and what it is called.The overlay can be a single bar, built one reading at a time — what is on it, in what order, under which name.Put it on screen over the desktop, over a game, or inside one app’s window — each with its own switch.Nothing has to stay on screen. It lives by the clock and starts with Windows.Or put the readings you care about straight on the taskbar.
How the widget works
It is an Xbox Game Bar widget rather than an app, so there is no Start-menu tile to look for:
press Win + G and it is there, over whatever you are running. Pin it and
it stays. The gear on its title bar opens its settings alongside it.
Three ways to read it
The same readings, arranged three ways. Table gives one row per sensor.
Table, grouped puts those rows under a heading for each part of the machine.
Panel — what you get by default — draws a tile per part, and lets any percentage
show as a ring gauge.
Panel tiles follow whatever size you drag the widget to: wide and they sit side by side,
narrow and they stack. You set how many columns a tile may use, from one to five, and a
reading too long for its column widens the column rather than being cut.
Diagram — the three view modes, not a screen
capture. The teal and orange marks against each reading are its low and its high, which the
next block explains.
Diagram — where the two marks sit, at both sizes.
Not a screen capture.
Every reading carries its low and its high
Beside every reading are the lowest and the highest it has reached, always in the same
order — the low first, then the high — and each introduced by a thin coloured tick:
teal for the low, orange for the high. In a table row the pair sits to the right of
the value; in a panel tile it sits directly underneath it.
The tick carries the identity so the digits do not have to. The live reading stays in
full-strength ink while the two extremes are dimmer and monospaced, and a low shown on its
own keeps its teal mark rather than passing for the current value.
They count from the moment Maxer Monitor started, not from when you opened the widget.
Reset min and max makes the panel start counting from now instead. And a sensor it
cannot read shows nothing at all rather than a zero: a fan reading 0 RPM is a far more
alarming thing to display than one reading nothing.
Grouped the way your machine is built
Every sensor files itself under CPU, GPU, memory, storage or board. Where that guess is
wrong for your hardware, move the device yourself.
Two sticks of memory are one subsystem; two SSDs are two drives. So any device can be told
to share a card with the rest of its part — and you choose which device names that
shared card, or whether each reading carries the name of the device it came from. Cards
take a name and a colour of your own, and a reading takes a shorter name, fewer decimals,
or a friendlier unit.
Everything the machine reports, filed by part, with a filter and a count per group.
Diagram — the three treatments, not a screen
capture.
A graph, a ring, or a line
Tick a sensor to show it, then choose how it is drawn. Graph plots its recent
history. Ring fills a gauge. List collapses it to a single compact line, for
the readings you want present but not prominent.
Ring is offered only where the reading is a percentage, because a gauge is honest only on a
natural nought-to-a-hundred range. In the table a graph is a proper chart — it states how
far back it reaches and the range it covers, around five minutes of it. In a panel tile it
is a shape rather than a chart, the last forty seconds or so. Either way a reading that
went missing leaves a gap, never a zero.
Open in the Game Bar, mid-benchmark, showing the readings a selection picked.
A preset to start from, and your own pick kept safe
Three ready-made selections — CPU and RAM, CPU and GPU, or CPU, RAM, GPU and drives — each
worked out against the sensors your machine actually reports rather than read off a fixed
list.
Choosing one puts your own selection safely aside; Custom brings it back. Change any
sensor by hand while a preset is on and it quietly becomes Custom, keeping your change. A
fresh install takes the widest of them for you, so the first time you open the widget there
is already something worth reading.
Built to sit over a game
Set the background anywhere between a fifth opaque and solid — or solid while you read it
here, and see-through only once it is pinned over a game. It is the plate behind the
readings that fades; the numbers stay at full strength, because a translucent value over
bright gameplay cannot be read at all.
Text size runs from a third to double, and carries every other dimension with it rather
than just the type. Compact mode drops the footer so the widget can shrink to a single row.
And it will take your own colours, because an overlay is read against the game rather than
against the desktop.
Pinned over a game: the plate fades, the readings do not.
Installing it
Run the download
Pick your language, then click through. Nothing to choose, no folder to pick.
Available in English and Spanish.
Say yes to the two prompts
Windows asks for permission to install, and again for the small driver that reads CPU
temperature. Without that driver everything still works except the CPU's own temperature.
Look next to the clock
The icon appears when it is running. Its menu turns reporting on or off, checks for
updates, and starts the app with Windows.
Took the portable zip instead? There is nothing to install: extract it and run
Maxer Portable.exe. If your account is an administrator it asks for permission each time
it starts — say no, or use a standard account, and it still runs, but without CPU temperature,
fans, voltages or FPS. If Maxer is also installed and running, it asks to close that first.
New versions are announced, never installed: download the new zip and extract it over the
folder, and your settings stay.
Verify what you downloaded
Optional, and worth it if you are cautious — this is how you confirm the file is the one we
published and not something swapped in on the way. Compare its SHA-256 fingerprint with this:
In PowerShell, from the folder you downloaded to:
The portable zip is a different file, with its own fingerprint:
If the two do not match, do not run it — delete it and download again.
What leaves your PC
By default the app also reports over the network: sensor readings, your machine's name, the
Windows account it runs under, and its hardware specification, sent over an encrypted
connection to our servers. This is on unless you turn it off, so it is worth knowing about even
though the app works fully without it.
You can switch it off. Untick “Send readings to the online dashboard”
in the icon's menu and nothing leaves the machine; the app keeps working and keeps showing you
your temperatures locally. No account, no email address, no browsing or file activity — it
reads hardware sensors and nothing else.
Read the full privacy statement — every field that is sent, where it
is stored, how long it is kept, and how to have it deleted.
Questions, bugs, or something to say
Something not working, a sensor reading wrong, or hardware we have never seen? Write to us — the
support page has the address and the four things worth putting in the
message. Feedback is wanted rather than tolerated: the app is in alpha and is
being shaped from a handful of machines, which is probably not yours.
Or say it in public: r/MaxerMonitor (opens in a new tab)
is the subreddit, and an answer there is one the next person with the same hardware can find.
Maxer Monitor is free, and the app you get is the same app whether or not anybody gives
anything. If it is useful to you and you would like to put something towards it:
A donation buys nothing — no licence, no feature, no priority — and it is a
one-off, not a subscription. You choose how much, and payment happens on the provider's own
page rather than here. The full statement is on the support
page.